Using Custom Maps in RCOM Gateway
Custom Maps in RCOM Gateway Gateway enable spatial representation of tracked assets by overlaying digital objects onto real-world layouts such as floor plans, warehouses, or campuses. This tool is ideal for visualizing object positions, managing zones, and interacting with object data contextually.
Create a New Custom Map
Where to begin
From the RCOM Gateway Gateway Dashboard, go to:
Custom Map → Manage Custom Maps
You’ll see a list of existing maps grouped by Access Group. Only users assigned to a given group can view or edit its maps.
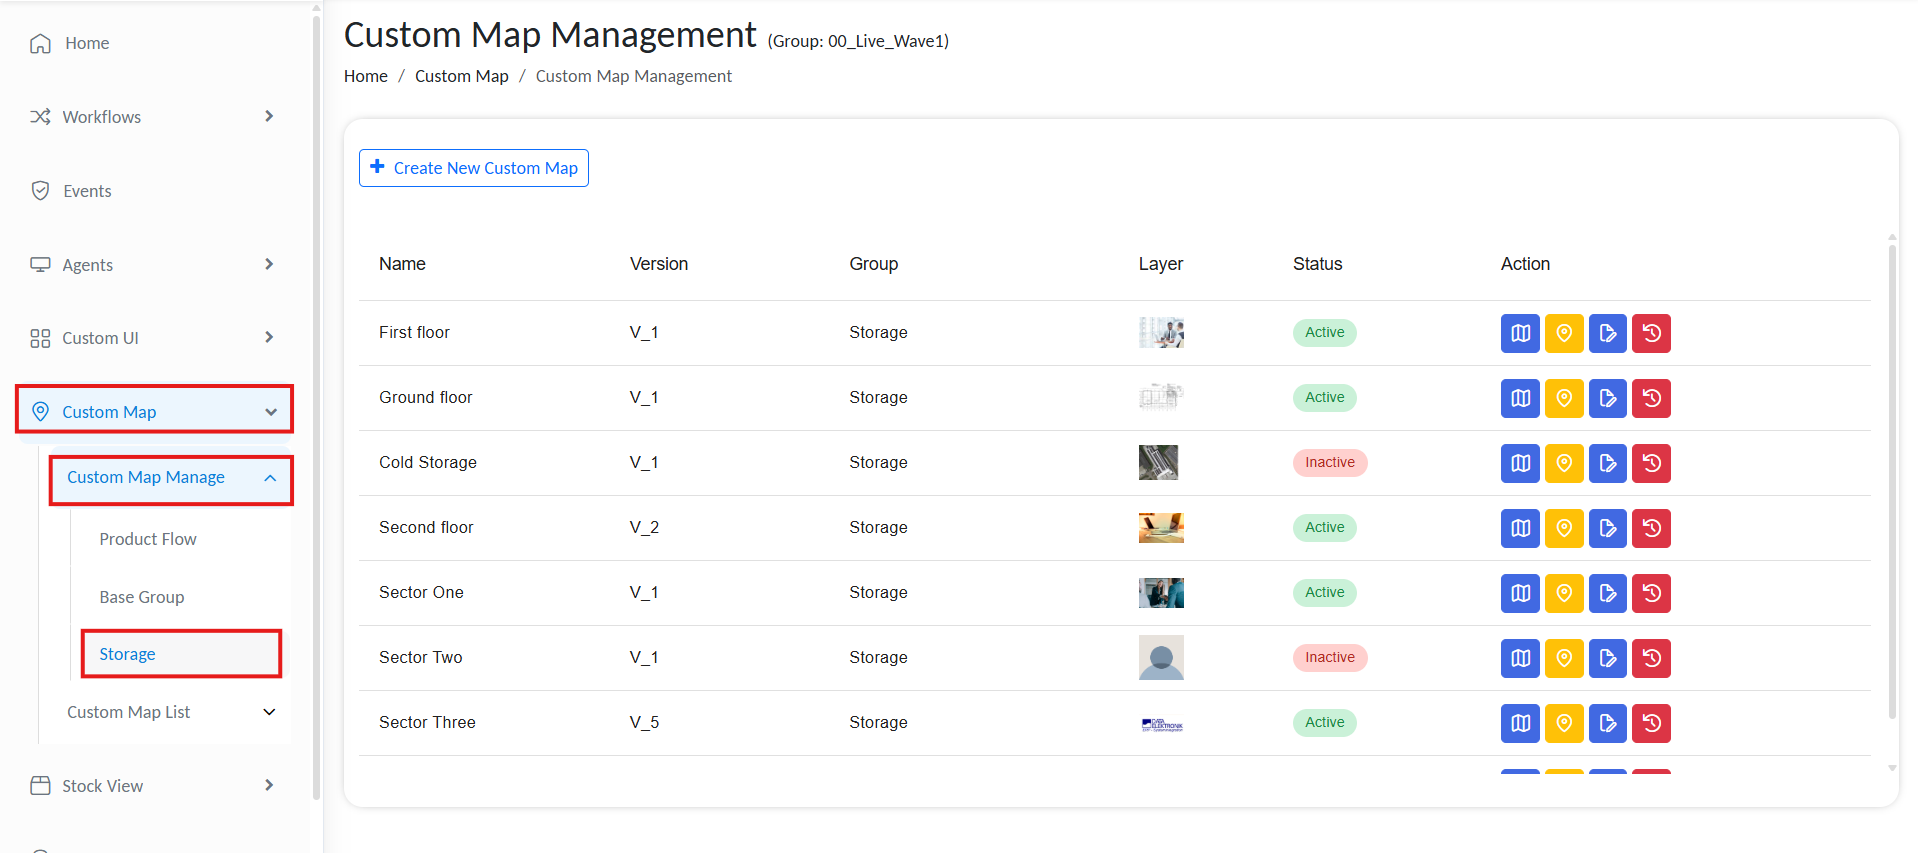
Custom map navigation
Step 1: Create a New Map
- Select the desired Access Group from the left-hand menu.
This filters the view to only show maps relevant to that group. - Click + Create New Map.
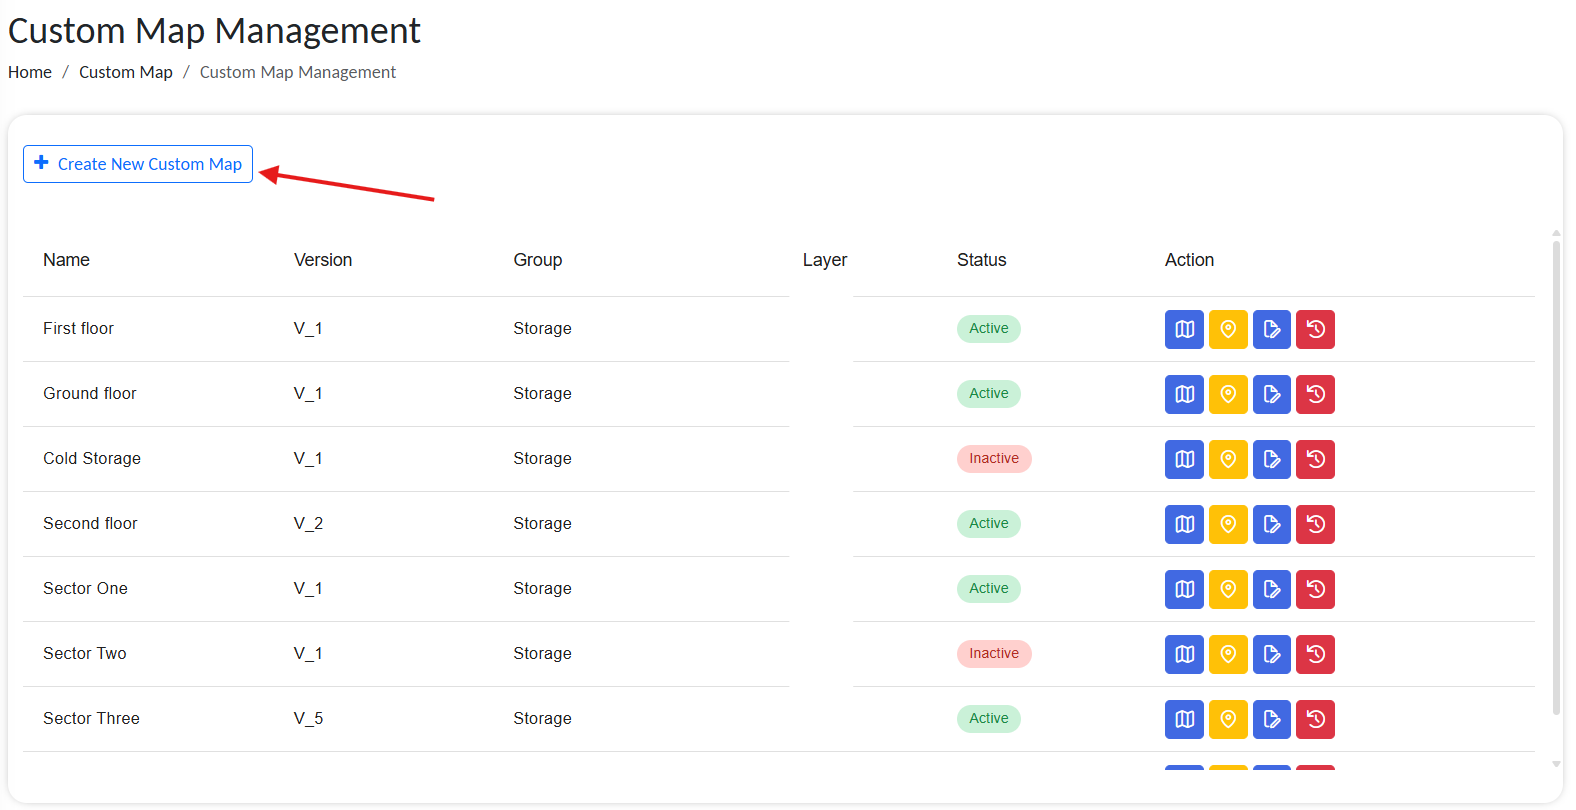
Create new custom map
This opens the Custom Map Configuration form.
Step 2: Fill Out Map Configuration
Start by adding one or more building layouts to configure.
- At the bottom, add a layer name
(A map can have multiple layers, e.g., Multiple floors of a building.) - Upload an image of the map/layout
- Click on + Add New Layer to add more layers.
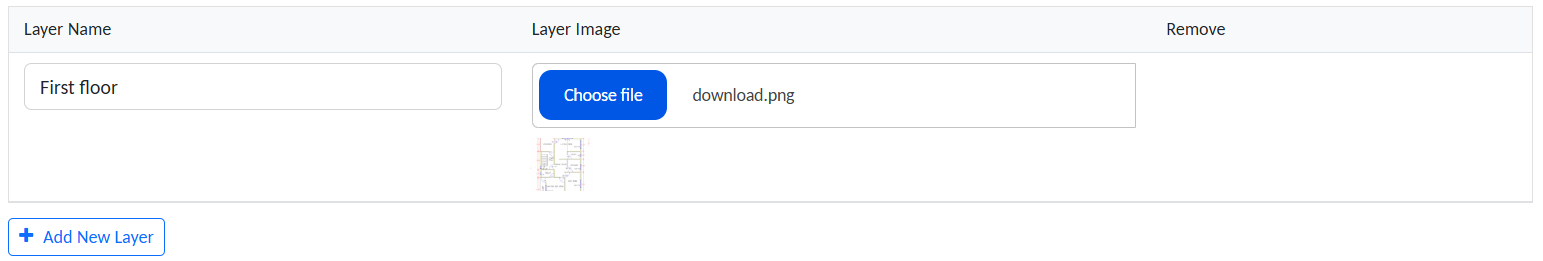
Add layout layers
A single map can support multiple layers, all aligned to the same coordinate system. This is useful when representing multiple floors of a building or when you want to group different sets of objects visually.
For example, you might use one layer to show all racks and another to show only high-value items, both mapped to the same layout.
To implement this, simply add multiple layers during map configuration.
In the configuration panel, complete the following fields:
| Field | Description |
|---|---|
| Custom Map Name | Display name for the map (e.g., GroundFloor) |
| Group | Selected Access Group. Only users from this group can interact with this map. |
| Left Bottom Geolocation | Physical world coordinate (GeoX, GeoY) for the bottom-left of the map. (e.g., 51.09068170613481, 10.380832526876302) |
| Right Top Geolocation | Physical world coordinate (GeoX, GeoY) for the top-right of the map. (e.g., 51.09068170613481, 10.380832526876302) |
| Left Bottom Coordinates | Pixel coordinates (X,Y) of the bottom-left corner of the image on screen or canvas. |
| Right Top Coordinates | Pixel coordinates (X,Y) of the top-right corner of the map image. |
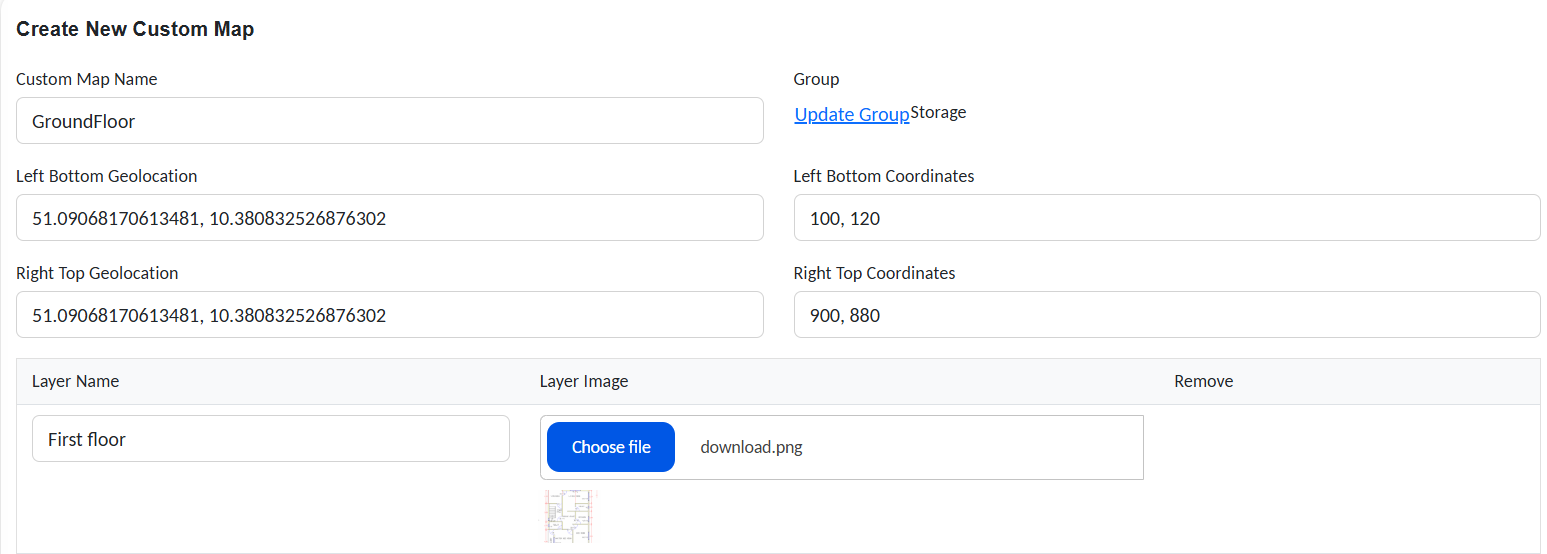
Configure new custom map
Use a clean, properly scaled image where the layout is clearly visible and objects can be visually mapped with accuracy.
The geolocation data will be aligned with pixel coordinates to ensure precise tracking and positioning within the map.
Tip: If your image contains white margins or padding around the layout, do not use the image’s full size as your coordinate bounds.
Instead, measure from the actual layout edges.
This ensures accurate geolocation mapping.
To find the correct pixel coordinates:
- Open the image in a viewer/editor like Paint or Photoshop.
- Locate the bottom-left and top-right corners of the actual layout (ignoring white space).
- Record the pixel positions of those points.
💡 Example:
If the full image is 1000×1000 pixels, and your layout begins at (100,120) and ends at (900,880):
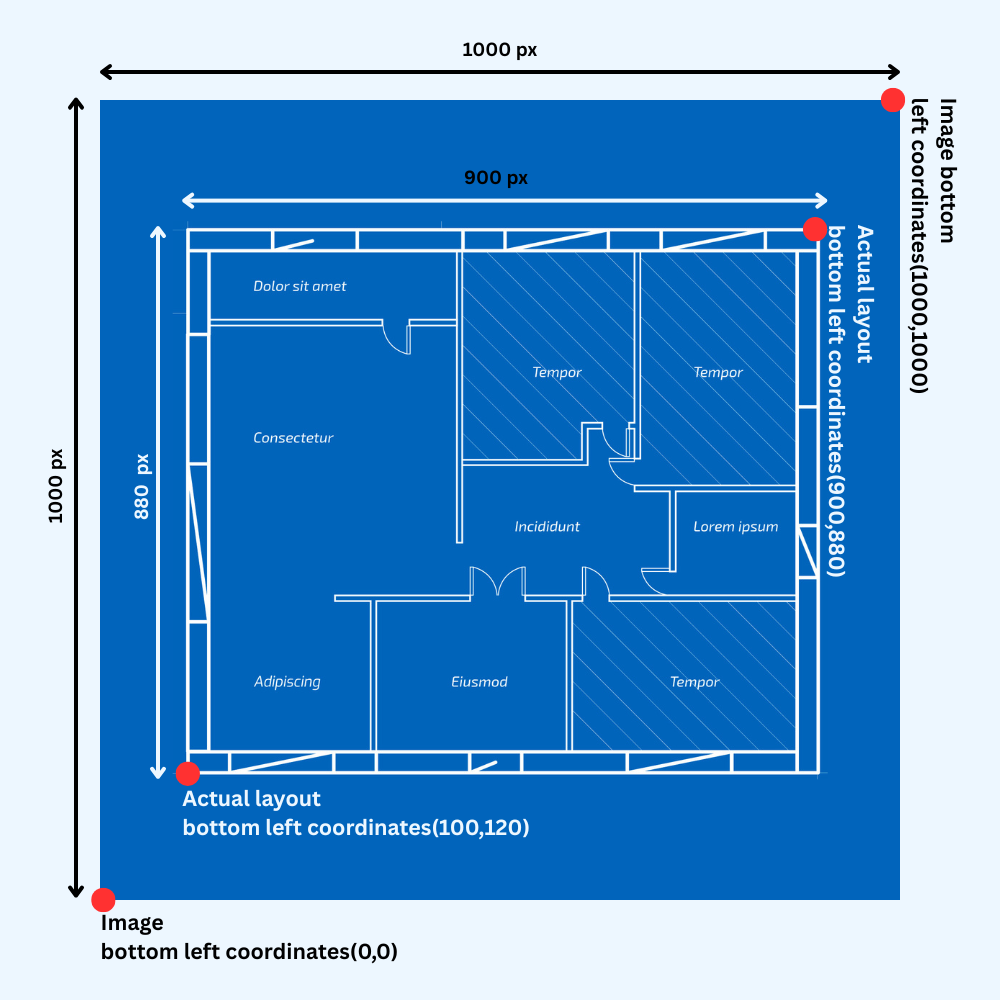
Custom map coordinates allocation
- Left Bottom Coordinates =
(100, 120) - Right Top Coordinates =
(900, 880)
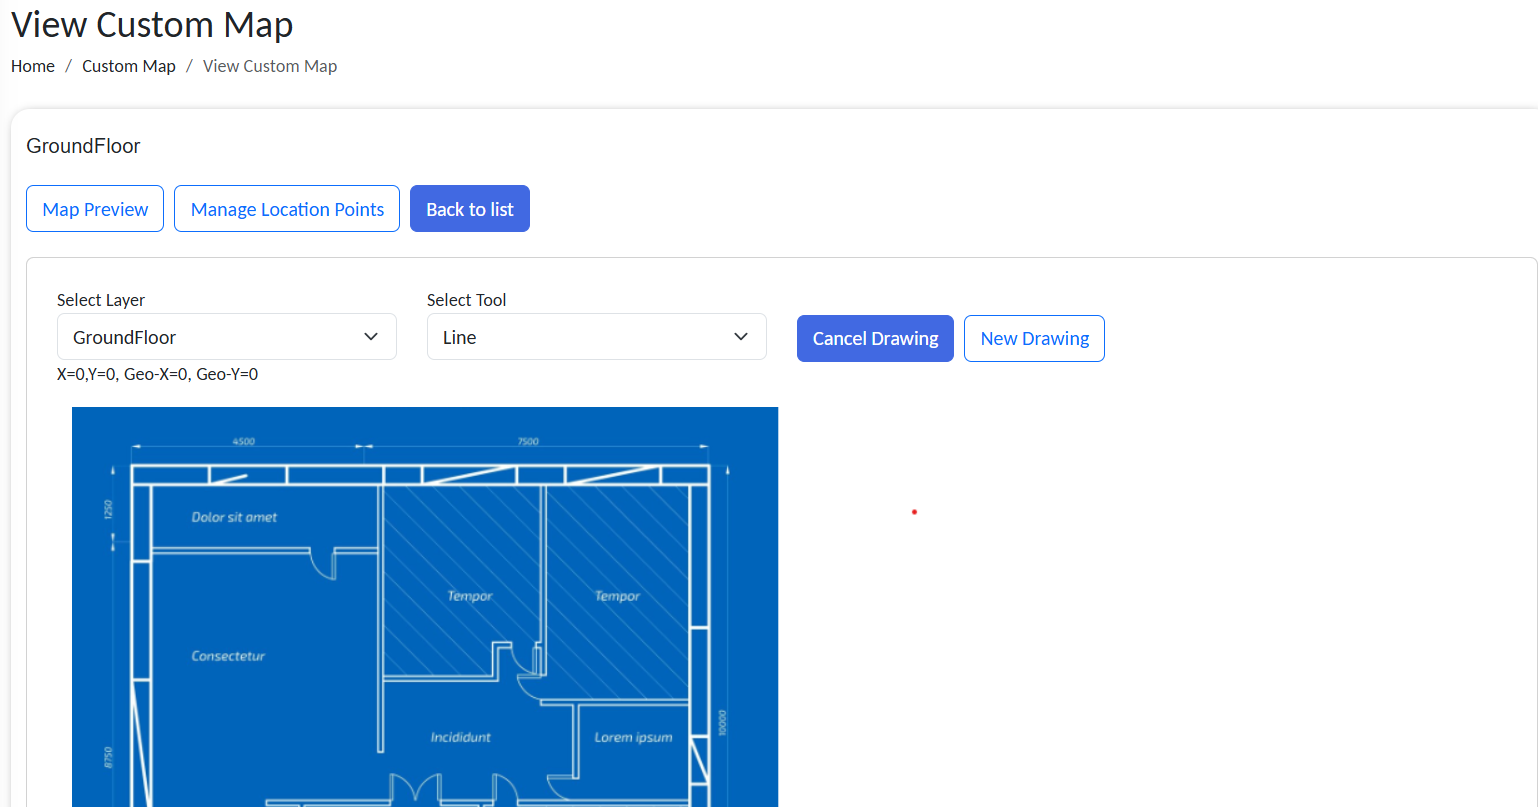
Step 3: View and Interact with the Map
After creation, return to the Custom Map List, and click the Set Locations icon next to your map entry to open the interactive viewer.
You will see the full map image with tools to draw and manage geolocations.
Assign custom map geolocations
Step 4: Draw Zones and Assign Location Points
Drawing Interface
| Component | Purpose |
|---|---|
| Select Layer | Choose which layer to draw on (e.g., Floor) |
| Select Tool | Drawing shape (Line, Rectangle) |
| New Drawing | Enables shape creation |
| Cancel Drawing | Discards the current shape |
| Manage Location Points | Opens the table of all defined geotag zones/areas/bins |
| Map Preview | Returns to map-only view |
Drawing Workflow
- Click on New Drawing.
- Select a drawing tool (e.g., Rectangle).
- Use the mouse to draw zones on the uploaded image (e.g., to outline storage bins or rooms).
- Click on Save Drawing.
- In the dialogue box, provide the info for the selected area:
- Storage Number
- Storage Location
- Storage Area
- Storage Bin
Zones can later be tied to object groups or logic in workflows.
Add new zone in map
Granularity for tagging storage positions:
- Storage Number only: marks an entire storage zone.
- Storage Number + Location: tags a specific location within that storage.
- Storage Number + Location + Area: defines a precise area.
- Storage Number + Location + Area + Bin: pinpoints an exact bin location.
On creation, all Custom map’s status will be set to Inactive. Activate them from the Manage Custom map page,
Step 5: Map Objects to Locations (Optional)
To enable real-time tracking:
- Link map areas to Object Groups that include
geo_xandgeo_yattributes. - Use the SetGeoLocation action in workflows to update an object’s coordinates.
These updates will reflect on the map in near real-time if configured properly.
View Map and Inspect Zone Data
Once a custom map is configured and saved, you can visually inspect it using the Map Preview feature.
This provides a real-time overview of all defined zones, such as storage numbers, locations, areas, and bins, layered onto your uploaded layout.
How to Access Map Preview
- Navigate to Custom Map → Custom Map List.
- Find your map entry and select.
This opens the map in a read-only view showing all marked regions and labels.
Only Active maps will be listed under the Custom map list. Make sure your map is active.
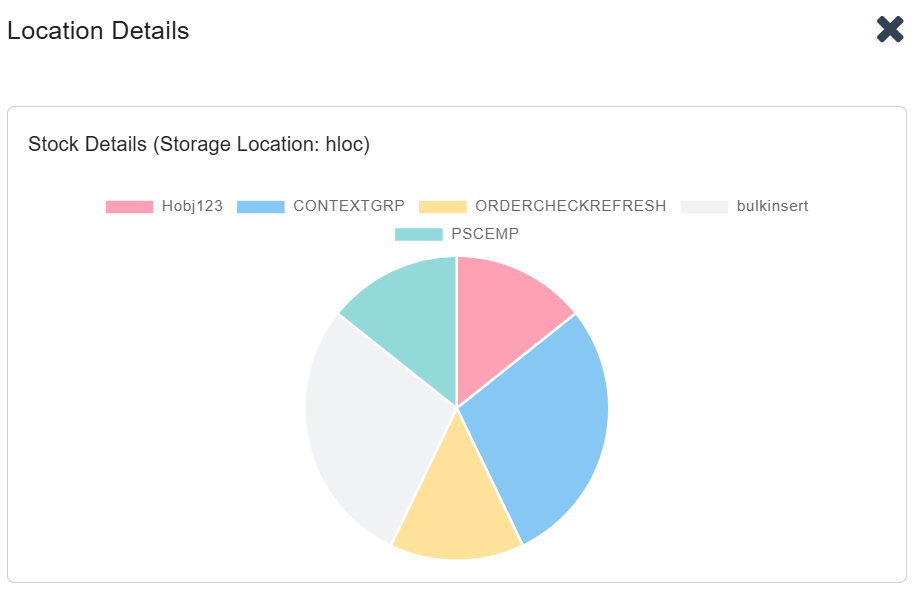
Interactive Zone Details
- Hover over or click on any marked zone (e.g., a bin or area).
- A pie chart will appear, showing a breakdown of the current objects present in that zone.
This chart is dynamically generated and reflects the latest data based on real-time object attributes like storage_number, location, area, and bin.
Add layout layers
This feature is ideal for quickly assessing object distribution, inventory clustering, or zone-specific density.
Zones are matched based on object attributes stored in object groups.
To ensure accuracy, workflows should update these fields consistently using the SetStorageLocation and SetGeoLocation actions.
✅ Best Practices
- Keep geolocation coordinate ranges (e.g., 0,0 to 100,100) proportional to your image resolution in pixels.
- Use distinct layer names and icons for clarity.
- Store maps under relevant Access Groups for visibility control.
- Use Line for irregular layouts and Rectangle for bins or rooms.