Events in RCOM Gateway
Events are the fundamental execution units in RCOM Gateway. Every interaction—whether triggered by an external system, device input, scheduled job, or internal workflow—results in the creation of an event. These events act as immutable records of what happened, when it happened, and how the system processed it.
At runtime, the platform is essentially an event-driven engine. Workflows do not operate in isolation; they are always executed in response to events. This makes events central to observability, debugging, auditing, and system reliability.
Event Lifecycle
An event in RCOM Gateway typically follows this lifecycle:
Event Creation
Triggered by:
- Endpoint API calls
- Device inputs (RFID, scanners, BLE, etc.)
- Scheduler jobs
- Internal workflow triggers
Event metadata and payload are captured at this stage.
Workflow Execution
One or more workflows are assigned to process the event.
Execution may include:
- Data transformation
- Conditional logic
- External integrations
- Object operations
Processing Completion
Event is marked with a final status.
Output and execution details are recorded.
Storage & Traceability
Event is persisted for audit, debugging, and analytics.
Event Structure
Each event contains structured metadata that allows full traceability:
| Field | Description |
|---|---|
| Event ID | Unique identifier for the event |
| Event Data | Payload received or generated |
| Created Time | Timestamp when event was created |
| Processed Time | Timestamp when processing completed |
| Event Status | Current state (Finished, Failed, etc.) |
| Type | Event classification (e.g., AllData) |
| Workflow Names | Workflows executed for this event |
| Event Source | Origin (Endpoint API, Scheduler, Device, etc.) |
| Processed By | Execution instance or node |
Event Status
Event status reflects the current state and outcome of event processing throughout its lifecycle:
- Undefined – Initial state when event is first created but not yet classified.
- Created – Event has been successfully created and registered in the system.
- Validating – Event is currently being validated against system rules and constraints.
- Consumed – Event has been consumed by one or more workflows and is being processed.
- Aborted – Event processing was stopped before completion due to a user-initiated action or system constraint.
- Failed – Event processing encountered an error and did not complete successfully.
- EndpointViolation – Event failed validation at the endpoint level, typically due to invalid data format or missing required fields.
- Finished – Event processing completed successfully.
These statuses are critical for monitoring system health and identifying operational issues.
Events Page
Purpose
The Events Page provides a centralized interface for viewing, analyzing, and troubleshooting all events processed by the system. It acts as the primary operational console for system visibility.
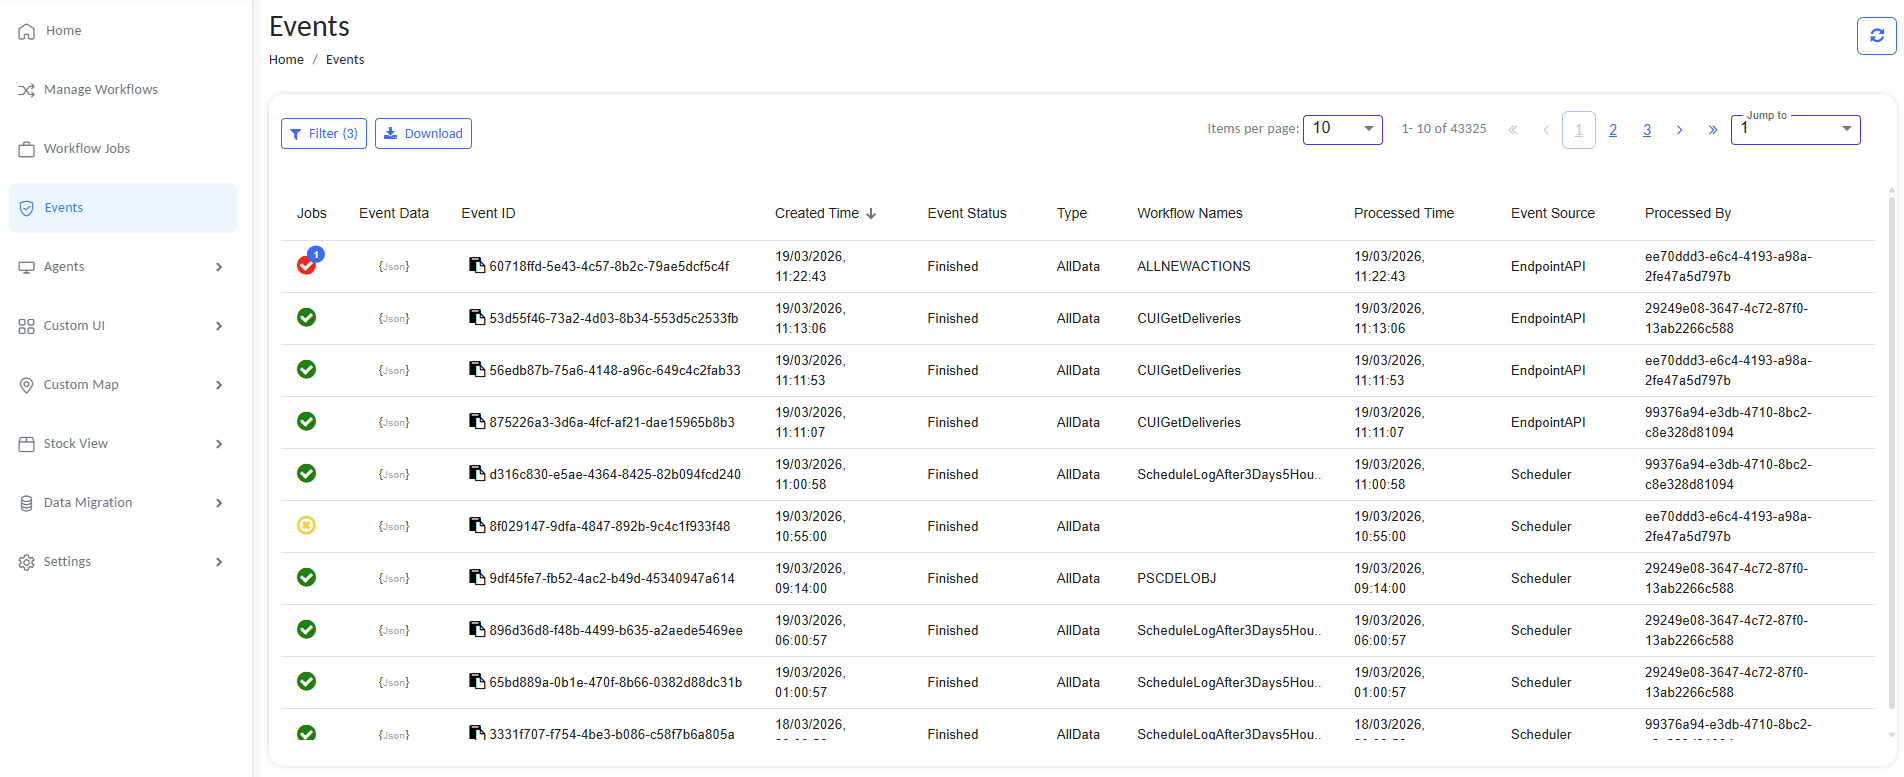
Events Page providing centralized event monitoring and analysis
Key Features of the Events Page
1. Event Listing
The page displays a tabular view of events with key metadata:
- Event ID
- Created Time
- Status
- Type
- Workflow Names
- Processed Time
- Event Source
- Processed By
This allows quick scanning of system activity.
2. Status Indicators
Visual indicators (icons/colors) are used for quick identification:
- 🟢 Green → Successful execution
- 🔴 Red → Failed execution
- 🟡 Yellow → Warnings or partial issues
This reduces the need to inspect each event manually.
By clicking on the status indicator, you can navigate to the related Workflow Job page where the workflow job is listed.
For detailed monitoring and troubleshooting guidance, see Workflow Jobs.
3. Event Data Access
Each event includes a JSON view of its payload
This is critical for debugging workflows and validating integrations.
4. Filtering
The Events Page supports filtering to narrow down results:
- By Event ID
- By Workflow Name
- By Event Status
- By Workflow Triggered
- By Event Type
- By Event Source
- By Created Date Range
- By Event Data (key or value without quotes)
Filtering is essential when dealing with high-volume environments (tens of thousands of events).
5. Pagination & Navigation
- Supports large datasets (e.g., 40k+ events)
- Configurable items per page
- Jump-to-page functionality
This ensures scalability without performance degradation in the UI.
6. Sorting
Events can be sorted by:
- Created Time
- Event Status
- Type
- Workflow Names
- Processed Time
- Event Source
- Processed By
This helps in analyzing recent activity or historical patterns.
7. Download / Export
The page provides export functionality:
- Download event data for offline analysis
- Useful for:
- Audit logs
- Incident investigation
- External reporting
Operational Use Cases
1. Debugging Workflow Failures
- Filter by Failed events
- Inspect event payload and workflow execution
- Identify:
- Incorrect data
- Integration failures
- Logic errors
2. Monitoring System Activity
Track:
- Number of events processed
- Event sources (API vs Scheduler vs Devices)
- Identify unusual spikes or drops
3. Identifying Problematic Workflows
Look for:
- Repeated failures from the same workflow
- High processing times
Helps prioritize fixes and optimizations.
4. Auditing & Traceability
Full history of:
- What was triggered
- When it happened
- What processed it
Critical for enterprise compliance and debugging production issues.
5. Event Source Analysis
Differentiate between:
- API-triggered events (EndpointAPI)
- Scheduled executions (Scheduler)
Helps understand system behavior patterns.
Design Considerations
High Volume Handling
RCOM Gateway is designed to handle:
- Millions of events per day
- Thousands of concurrent sources
The Events Page reflects this with:
- Efficient pagination
- Lazy loading
- Optimized queries
Immutable Event Records
Events are not modified after creation:
- Ensures audit reliability
- Enables consistent debugging
Decoupled Processing
Events are independent:
- Failure of one event does not impact others
- Enables high resilience and scalability
Best Practices
- Regularly monitor failed events instead of ignoring them
- Use filtering aggressively in high-volume systems
- Correlate events with workflow logs for deeper debugging
- Export event data for complex investigations
- Track recurring failures to identify systemic issues